See disruptions developing. Not arriving.
The supply chain industry spent a decade building dashboards. SupplyMaven is what comes next. Continuous monitoring that shows you what's developing, tells you what it means, and recommends what to do about it, before disruptions reach your production floor.
14-day free trial available on Dashboard Pro and above
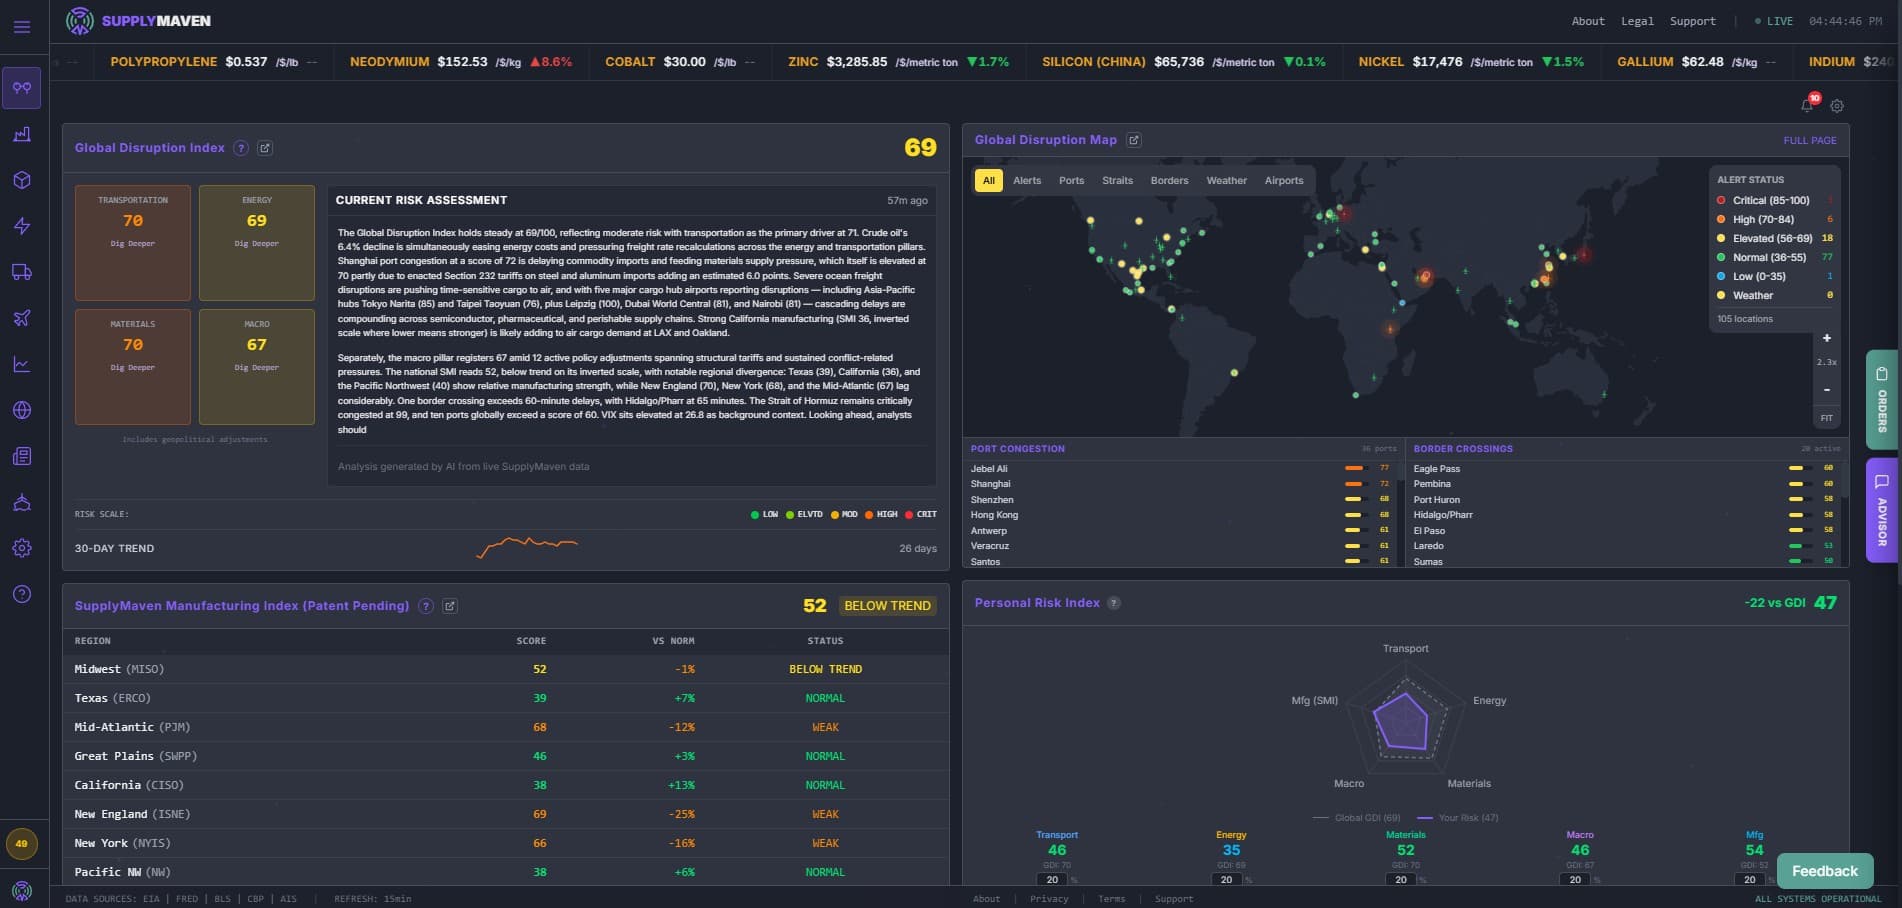
Live data from SupplyMaven — 41 ports, 81 border crossings, 31 commodities, and 8 power grids. Updated every 15 minutes.
This is what continuous monitoring looks like. Not a static report. Not a weekly email. A live command center tracking manufacturing activity, port congestion, border delays, commodity moves, and macro risk, updated every 15 minutes.
See what's developing
SupplyMaven monitors 41 ports and chokepoints, 81 border crossings, 31 commodities, 8 regional power grids, and macro indicators around the clock. Updated every 15 minutes. By the time a disruption appears in government reports or industry newsletters, SupplyMaven has been watching it develop for days or weeks.
Understand what it means
Raw data is noise. SupplyMaven synthesizes monitoring signals into plain-English intelligence briefs that tell you what is changing, why it matters, and how it connects to your specific exposure. Generated from real composite data, not generic news summaries. Delivered to your dashboard continuously and to your inbox every Monday.
Know what to do
Alerts are only useful if they tell you what to do next. SupplyMaven pairs every alert with specific recommended actions based on what the signal means for procurement, scheduling, and sourcing. Not every headline. Just the signals that matter, with the response that fits.
Available from $49/month
Available from $49/month
Available from $49/month
Available from $49/month
See what's developing. Know what to do.
Start monitoring for $49/month. 14-day free trial on Dashboard Pro and above. Cancel anytime.
See Plans & Pricing